Difference between revisions of "VolCT - Group 1C"
Jump to navigation
Jump to search
| Line 27: | Line 27: | ||
*Test report documents | *Test report documents | ||
| − | **[[Media:QiBA 1C Performance Protocol Testing Report Formv2 3.xls|QIBA 1C Performance Protocol Testing Report on Siemens S64 Form v2_3]] ''Posted 05-04- | + | **[[Media:QiBA 1C Performance Protocol Testing Report Formv2 3.xls|QIBA 1C Performance Protocol Testing Report on Siemens S64 Form v2_3]] ''Posted 05-04-2010'' |
**[[Media:QiBA 1C Performance Protocol Testing ACRIN 6678 Report Formv2 3.xls|QIBA 1C ACRIN 6678 Testing Report on Siemens S64 Form v2_3]] ''Posted 05-04-2010'' | **[[Media:QiBA 1C Performance Protocol Testing ACRIN 6678 Report Formv2 3.xls|QIBA 1C ACRIN 6678 Testing Report on Siemens S64 Form v2_3]] ''Posted 05-04-2010'' | ||
**[[Media:QIBA 1C Performance Protocol Testing Report Form UCLA SiemensS64 3 26 10 v2.xls|QIBA 1C Performance Protocol Testing Report on Siemens S64 v2]] ''Posted 03-26-2010'' | **[[Media:QIBA 1C Performance Protocol Testing Report Form UCLA SiemensS64 3 26 10 v2.xls|QIBA 1C Performance Protocol Testing Report on Siemens S64 v2]] ''Posted 03-26-2010'' | ||
Revision as of 20:33, 4 May 2010
- Characterizing Variability, sans Biology
- Multiple image sets of the same phantoms re-scanned across centers to isolate contributors to variability.
- The goal is to determine necessary control conditions to be documented in profiles ensuring that the output for imaging when performed under these conditions will be adequately precise and accurate when scanned on profile-compliant equipment.
- Related Profile: Lung Vol Quantification - Measurement Activity
- Vol-CT 1C Group Call Summaries
Working Documents
- Sources of Variability - Andrew Buckler
- Volumetric CT Image Analysis (Part 1C) with AJB markup
- Volumetric CT Image Analysis (Part 1C) v3
- Volumetric CT Group 1C Strawman-20090506
1C Performance Protocol
- 1C Physics Testing for ACRIN 6678 Protocol ver 3.0 (testing for different patient size not memtioned) 2010-04-28
- 1C Physics Testing for Performance-based Protocol ver 3.0 (now based on ACRIN 6678) 2010-04-28
- QIBA 1C Performance Protocol v2.2 (03-27-2010)
- QIBA 1C Performance Protocol Dec 20 2009 v2.1 (2010-01-13)
- QIBA 1C Performance Protocol Testing Report Form v2.1 (2010-01-13)
- QIBA Q-CT Group 1C Protocol 20091223 (2010-01-13)
UCLA Pilot Data
- Test report documents
- QIBA 1C Performance Protocol Testing Report on Siemens S64 Form v2_3 Posted 05-04-2010
- QIBA 1C ACRIN 6678 Testing Report on Siemens S64 Form v2_3 Posted 05-04-2010
- QIBA 1C Performance Protocol Testing Report on Siemens S64 v2 Posted 03-26-2010
- QIBA 1C Performance Protocol Testing Report on Siemens S64 v1 Posted 03-22-2010
- QIBA 1C ACRIN 6678 Testing Report on Siemens S64 Posted 03-26-2010
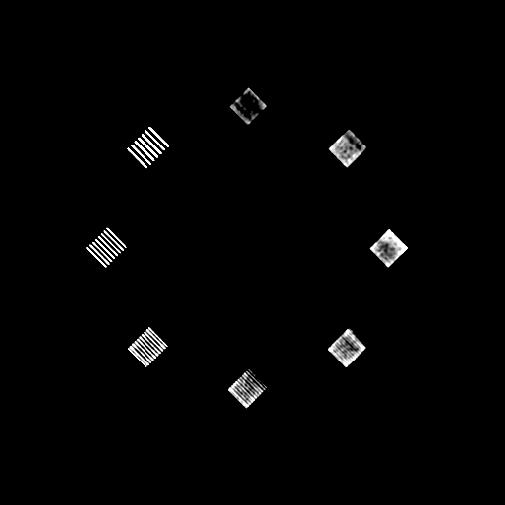
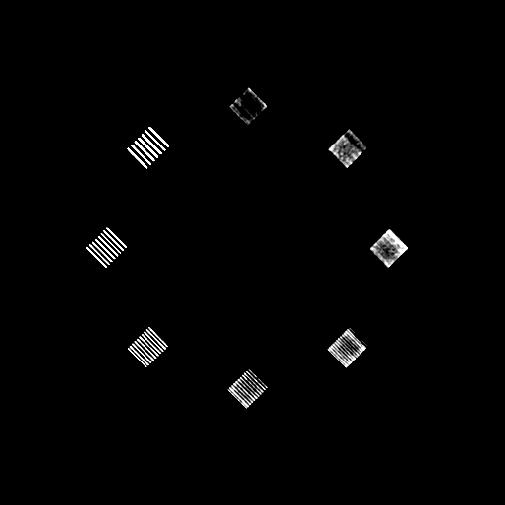
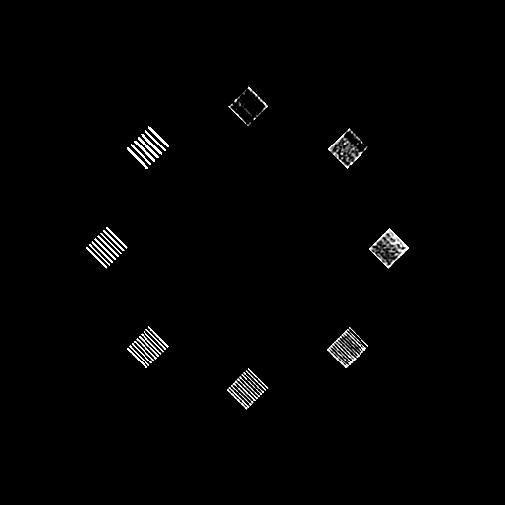
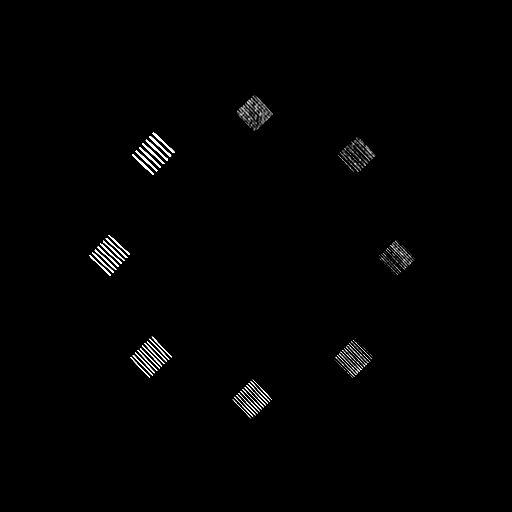
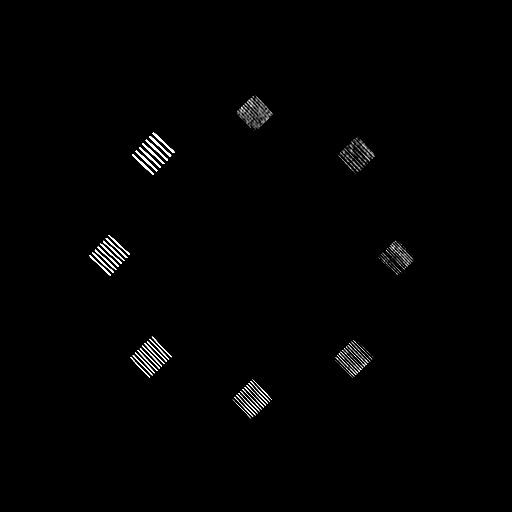
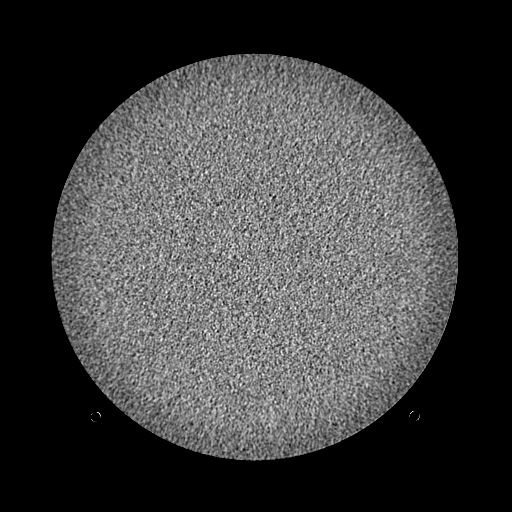
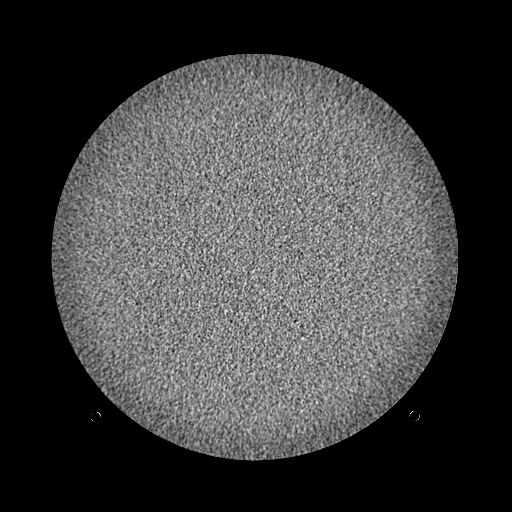
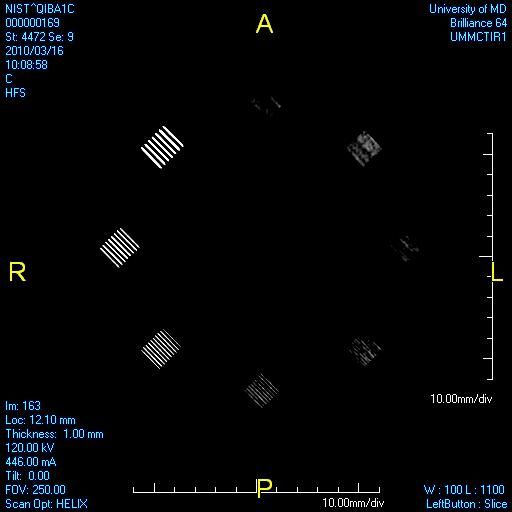
- Images (noise and resolution slices)
Duke Pilot Data
- Test report documents
- QIBA 1C Performance Protocol Testing Report on Duke GE System Posted 03-11-2010
- Duke GE System Acquisition of 01.09.2010 Posted 03-11-2010
- Images (noise and resolution slices)
- Resolution lp/cm 250mA detail Posted 03-11-2010
- Resolution lp/cm 325mA detail Posted 03-11-2010
- Noise level 250mA detail-2 Posted 03-11-2010
- Noise level 325mA detail-2 Posted 03-11-2010
FDA Pilot Data
- Test report documents
- Images (noise and resolution slices)
Johns Hopkins Pilot Data
- Test report documents
- Images (noise and resolution slices)
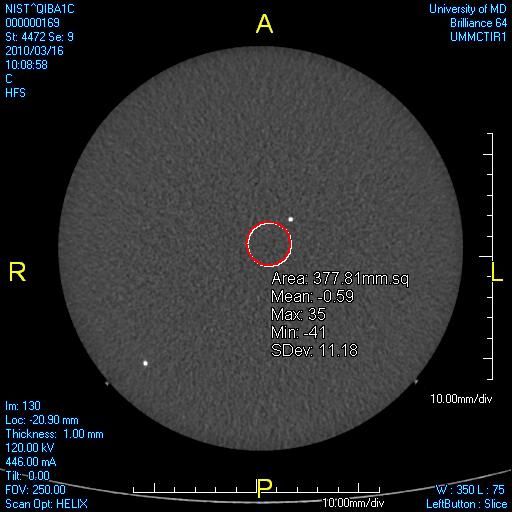
Univ Maryland Pilot Data
- Test report documents
- Images (noise and resolution slices)
- Resolution lp/cm detail Posted 03-24-2010
- Noise level Posted 03-24-2010